Pandas Pivot Table Without Aggregation | Create Your Own
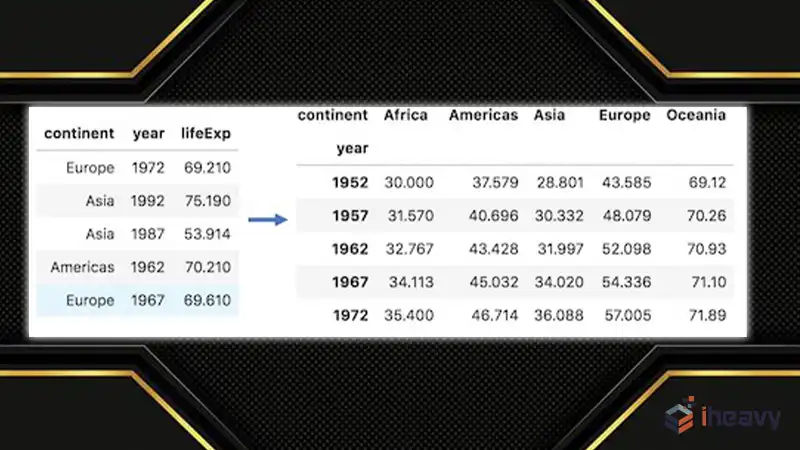
Discover the versatility of Pandas pivot tables, where data organization takes center stage, sans the need for aggregation. By simply setting the ‘aggfunc’ parameter to ‘None’, you unlock a powerful tool for reshaping your data effortlessly. This allows you to pivot your dataset around unique dates and categories, showcasing the original values in a structured format.
Even in cases of duplicate entries within index-column pairs, each instance is distinctly represented, providing a comprehensive overview of your data’s intricate relationships. Let’s hear more.
Common Scenarios Where Pivot Tables Without Aggregation Are Useful
Pivot tables without aggregation in Pandas are particularly useful in scenarios where you need to reorganize and analyze data without summarizing or aggregating values. Here are some common scenarios where they prove beneficial:
Data Exploration and Visualization
When you want to explore the relationships between variables in a dataset without summarizing data, pivot tables without aggregation help in organizing data for visualization, allowing you to identify patterns and trends easily.
Comparative Analysis
For comparative analysis across different categories or time periods, pivot tables without aggregation enable side-by-side comparison of raw data values, facilitating insights into variations and differences without losing granularity.
Data Cleaning and Preprocessing
In data cleaning tasks, pivot tables without aggregation can assist in identifying missing values, outliers, or inconsistencies by providing a structured view of the dataset, aiding in data preprocessing before further analysis.
Cross-Tabulation
When you need to cross-tabulate categorical variables to examine their relationships, pivot tables without aggregation offer a convenient way to organize data into a tabular format, enabling deeper analysis and interpretation.
Data Reshaping for Machine Learning
In machine learning workflows, pivot tables without aggregation can be useful for reshaping data into a format suitable for model training, especially when dealing with categorical features or multi-index data structures.
Comparing Actual vs. Target Values
For performance analysis or benchmarking purposes, pivot tables without aggregation allow you to compare actual values against target values without averaging or summing up data, providing insights into deviations and performance metrics.
Data Export and Reporting
In reporting tasks, pivot tables without aggregation help in structuring data for export to external tools or formats, facilitating the creation of detailed reports or dashboards while preserving the granularity of underlying data.
Code for Creating Pivot Table Importing Pandas But Without Aggregation
import pandas as pd
# Sample DataFrame
data = {
    'Date': ['2024-05-01', '2024-05-01', '2024-05-02', '2024-05-02'],
    'Category': ['A', 'B', 'A', 'B'],
    'Value': [10, 20, 30, 40]
}
df = pd.DataFrame(data)
# Create pivot table without aggregation
pivot_table = df.pivot_table(index='Date', columns='Category', values='Value', aggfunc=None)
print(pivot_table)
Customizing the Row-Column Labels In Pandas Pivot Table Without Aggregation
In Pandas, you can customize row and column labels in a pivot table without aggregation by using the ‘index’ and ‘columns’ parameters when creating the pivot table. Here’s how you can do it:
import pandas as pd
# Sample DataFrame
data = {
    'Date': ['2024-05-01', '2024-05-01', '2024-05-02', '2024-05-02'],
    'Category': ['A', 'B', 'A', 'B'],
    'Value': [10, 20, 30, 40]
}
df = pd.DataFrame(data)
# Create pivot table without aggregation and customize row and column labels
pivot_table = df.pivot_table(index='Date', columns='Category', values='Value', aggfunc=None)
# Rename row and column labels
pivot_table.index.name = 'Date'
pivot_table.columns.name = 'Category_Type'
print(pivot_table)
Handling Missing Values When Creating A Pivot Table Without Aggregation
When creating a pivot table without aggregation in Pandas, missing values can be handled using the fill_value parameter. This parameter allows you to specify a value to replace any missing entries in the resulting pivot table. Here’s how you can handle missing values:
import pandas as pd
# Sample DataFrame with missing values
data = {
    'Date': ['2024-05-01', '2024-05-01', '2024-05-02', '2024-05-02', '2024-05-01'],
    'Category': ['A', 'B', 'A', 'B', 'A'],
    'Value': [10, 20, 30, None, 50]  # Adding a None value for demonstration
}
df = pd.DataFrame(data)
# Create pivot table without aggregation and handle missing values
pivot_table = df.pivot_table(index='Date', columns='Category', values='Value', aggfunc=None, fill_value=0)
print(pivot_table)
The fill_value parameter is set to 0, which means any missing values in the pivot table will be replaced with 0. You can replace 0 with any other value that makes sense for your analysis, such as ‘NA’ or np.nan if you prefer to keep missing values as NaNs.
Exporting The Results Of A Pivot Table Without Aggregation To A File
You can export the results of a pivot table without aggregation to a file using various file formats supported by Pandas, such as CSV or Excel. Here’s how you can export the pivot table to a CSV file:
import pandas as pd
# Sample DataFrame
data = {
    'Date': ['2024-05-01', '2024-05-01', '2024-05-02', '2024-05-02'],
    'Category': ['A', 'B', 'A', 'B'],
    'Value': [10, 20, 30, 40]
}
df = pd.DataFrame(data)
# Create pivot table without aggregation
pivot_table = df.pivot_table(index='Date', columns='Category', values='Value', aggfunc=None)
# Export pivot table to a CSV file
pivot_table.to_csv('pivot_table.csv')
print("Pivot table exported to pivot_table.csv")
Frequently Asked Questions
What are some alternative methods to pivot tables for reshaping data in Pandas?
In Pandas, alternative methods for reshaping data include using functions like stack() and unstack(), melt(), and pivot() to achieve similar results to pivot tables. These methods provide flexibility in reshaping data based on specific requirements and can be used as alternatives or in combination with pivot tables.
Can I apply filtering or sorting to a pivot table created without aggregation in Pandas?
Yes, you can apply filtering or sorting to a pivot table created without aggregation in Pandas. After creating the pivot table, you can use methods like sort_values(), sort_index(), and boolean indexing to sort the data and apply filters based on specific criteria, enabling further customization and analysis of the data.
Are there any performance considerations when working with large datasets and pivot tables in Pandas?
When working with large datasets and pivot tables in Pandas, performance considerations include memory usage, processing time, and efficiency of operations. To optimize performance, it’s important to minimize unnecessary calculations, use appropriate data types, consider memory-efficient techniques like chunking or sampling, and utilize parallel processing where applicable, especially for computationally intensive tasks.
Additionally, avoiding unnecessary copying of data and leveraging built-in Pandas functions and optimizations can help improve performance when working with large datasets and pivot tables.
Concluding Remarks
Pandas offers a versatile toolset for creating pivot tables without aggregation, facilitating data reshaping and analysis. Customization options such as renaming row and column labels provide further flexibility in tailoring pivot tables to specific analytical needs.
Moreover, Pandas offers seamless handling of missing values through the ‘fill_value’ parameter, ensuring robustness in data analysis. Lastly, the ability to export pivot table results to various file formats enhances data sharing and collaboration.