
How to Install Graphviz in Jupyter Notebook | Complete Guide
Graphviz is a powerful tool for visualizing graphs and networks. It is widely used in data science and machine learning for creating visual representations of data structures and algorithms. Installing Graphviz in a Jupyter Notebook environment can enhance your ability to illustrate complex relationships and workflows. This article will guide you through the process of installing Graphviz in Jupyter Notebook and demonstrate how to use it.
Prerequisites
Before installing Graphviz, ensure you have the following prerequisites:
Python: Python should be installed on your system.
Jupyter Notebook: A working Jupyter Notebook environment.
Installation Steps
Step 1: Install Graphviz Software
First, you need to install the Graphviz software on your system. This can be done using package managers like apt-get on Ubuntu or brew on macOS.
For Ubuntu:
bash
Copy code
sudo apt-get install graphviz
For macOS:
bash
Copy code
brew install graphviz
For Windows:
Download the installer from the Graphviz website.
Follow the installation instructions.
Step 2: Install Graphviz Python Library
Next, you need to install the graphviz Python library. You can do this using pip.
bash
Copy code
pip install graphviz
Step 3: Verify Installation in Jupyter Notebook
To verify that Graphviz is installed correctly, you can run a simple test in Jupyter Notebook.
Open a new Jupyter Notebook.
Import the graphviz library and create a simple graph.
python Code
import graphviz
# Create a new Digraph object
dot = graphviz.Digraph()
# Add nodes and edges
dot.node('A', 'Node A')
dot.node('B', 'Node B')
dot.edge('A', 'B', 'Edge from A to B')
# Render the graph
dot.render('test-output/graph', view=True)
If everything is installed correctly, this code will generate and display a simple graph with two nodes and one edge.
Example: Visualizing a Decision Tree
Here’s an example of how to visualize a decision tree using Graphviz in Jupyter Notebook.
python Code
from sklearn.datasets import load_iris
from sklearn.tree import DecisionTreeClassifier
from sklearn.tree import export_graphviz
# Load the Iris dataset
iris = load_iris()
X, y = iris.data, iris.target
# Train a decision tree classifier
clf = DecisionTreeClassifier()
clf.fit(X, y)
# Export the decision tree to a Graphviz format
dot_data = export_graphviz(clf, out_file=None,
                           feature_names=iris.feature_names,
                           class_names=iris.target_names,
                           filled=True, rounded=True,
                           special_characters=True)
# Create a Graphviz source object
graph = graphviz.Source(dot_data)
graph
This code snippet trains a decision tree classifier on the Iris dataset and visualizes the decision tree using Graphviz.
Frequently Asked Questions
Q1: What is Graphviz used for?
Graphviz is used for creating visual representations of graph data structures. It is particularly useful in fields like data science, machine learning, and software engineering for visualizing complex relationships and workflows.
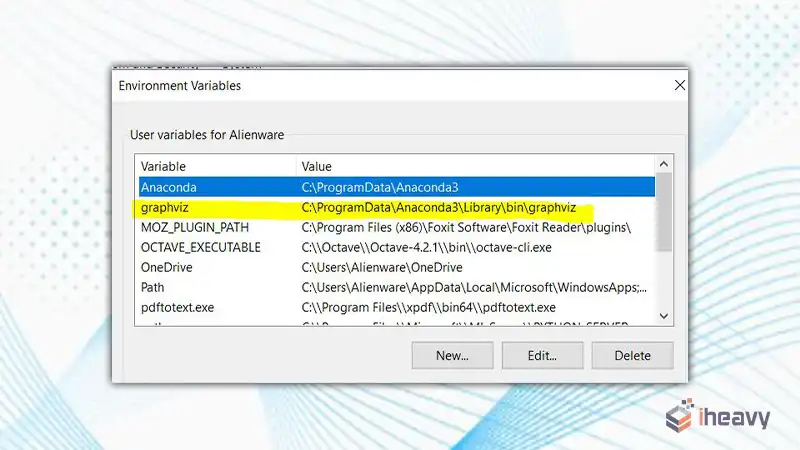
Q2: I installed Graphviz, but it doesn’t work in Jupyter Notebook. What should I do?
Ensure that the Graphviz executable is in your system’s PATH. You might need to restart Jupyter Notebook or your computer after installation. Also, ensure that the graphviz Python package is installed in the same environment as Jupyter Notebook.
Q3: Can I use Graphviz with other Python libraries?
Yes, Graphviz can be used in conjunction with other Python libraries such as networkx for more advanced graph visualizations and analyses.
Conclusion
Installing Graphviz in a Jupyter Notebook environment allows you to create and visualize complex graphs and networks easily. By following the steps outlined in this article, you can set up Graphviz and start using it for your data visualization needs. Whether you’re visualizing decision trees, network graphs, or other data structures, Graphviz provides a powerful toolset for enhancing your data science and machine learning projects.

![How to Fix java.lang.NullPointerException | [Answered]](https://www.iheavy.com/wp-content/uploads/2024/06/How-to-Fix-java.lang_.NullPointerException-768x432.webp)