
How to Clean and Preprocess Big Data Sets for Accurate Analysis
Data is the new oil. However, raw data is like crude oil – it needs refining before it becomes a valuable product. This refinement process is known as data cleaning and preprocessing. For big data, this process is even more critical due to its sheer volume and complexity.
Data cleaning and preprocessing are crucial steps in ensuring the accuracy and reliability of any analysis. This article discusses essential techniques and best practices for cleaning and preprocessing big datasets for accurate analysis.
What Is Data Cleaning and Preprocessing in Big Data?
Data cleaning is the foundational step in preparing your data for analysis. It involves transforming raw data into a usable format by addressing issues like missing values, inconsistencies, and duplicates. Building upon this clean dataset, data preprocessing takes it further by applying advanced techniques such as feature engineering to optimize the data for specific analyses or models.
Why Data Cleaning and Preprocessing Matter
Before diving into the technical details, it’s essential to understand why data cleaning and preprocessing are vital:
Accuracy: Clean data ensures that analysis reflects the true state of the underlying processes.
Consistency: Uniform data structures and formats allow for straightforward comparisons and analyses.
Efficiency: Preprocessing reduces the computational resources required for analysis by removing irrelevant or redundant information. Also, Clean data is often easier and faster to process, saving computational resources.
Reliability: Increases the trustworthiness of analytical outcomes, aiding in confident decision-making. By removing noise, you can focus on the essential patterns and trends in your data.
How Would You Clean and Preprocess a Dataset Before Analysis?
Below are five essential steps to transform raw data into a clean, usable format ready for analysis.
1. Data Profiling and Exploration
The first step is to understand the data. This involves:
- Data Summary: Get basic statistics like count, mean, median, standard deviation, and quartiles for numerical columns.
- Data Types: Check data types (numeric, categorical, date, etc.) for inconsistencies.
- Missing Values: Identify columns with missing values and their percentage.
- Outliers: Detect extreme values that might skew the data.
- Data Distribution: Visualize data distributions to identify patterns and anomalies.
Example: Using Python libraries like Pandas and NumPy, you can calculate summary statistics, check data types, and find missing values:
import pandas as pd
import numpy as np
# Load data
data = pd.read_csv("your_data.csv")
# Summary statistics
print(data.describe())
# Check data types
print(data.dtypes)
# Missing values
print(data.isnull().sum())
2. Handling Missing Values
Missing data is a common issue that can skew analysis. Strategies to handle missing values include:
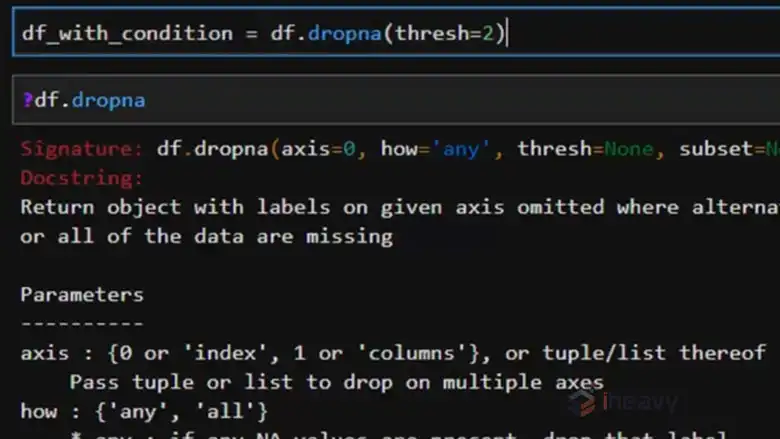
- Removal: Eliminate rows or columns with missing values if they are few and not critical.
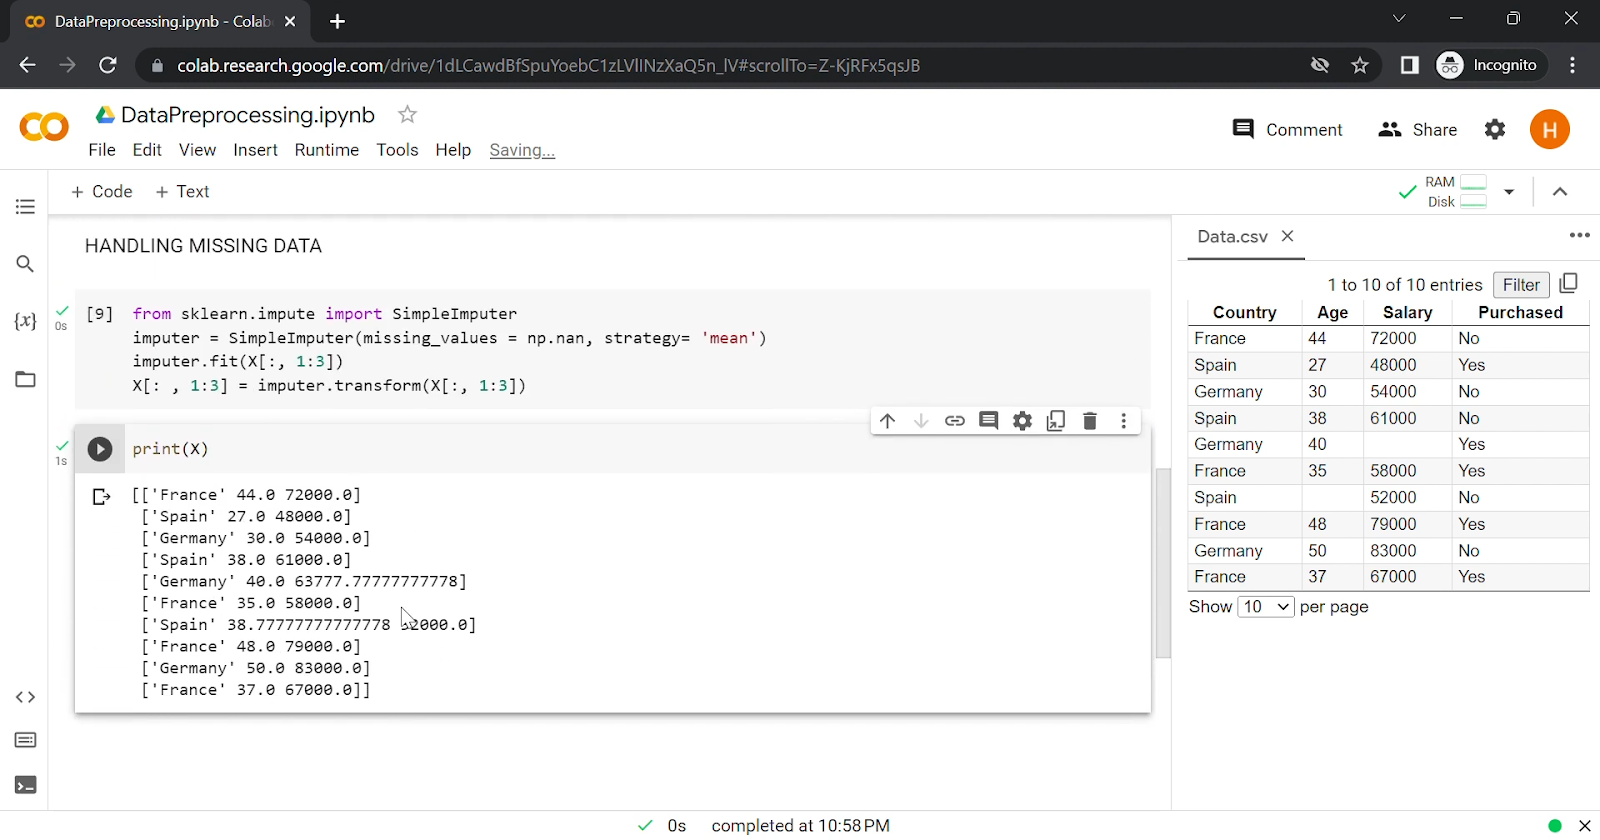
- Imputation: Use statistical methods to fill in missing values, such as mean, median, or mode imputation, or more sophisticated methods like k-nearest neighbors or machine learning models.
- Flagging: Mark missing values as a separate category if they represent an essential aspect of the dataset (e.g., “unknown”).
Example: Using Pandas, you can fill missing numerical values with the mean:
data[‘column_with_missing_values’] = data[‘column_with_missing_values’].fillna(data[‘column_with_missing_values’].mean())
3. Removing Duplicates
Duplicate entries can lead to biased results. Identify and remove duplicates based on unique identifiers or a combination of features.
import pandas as pd
# Example: Removing duplicates in a DataFrame
df = pd.DataFrame({
    'ID': [1, 2, 2, 3, 4, 4],
    'Value': [100, 200, 200, 300, 400, 400]
})
# Remove duplicates
df = df.drop_duplicates()
print(df)
4. Outlier Detection and Handling
Outliers can distort analysis. Techniques to identify outliers include:
Z-score: Identify outliers based on standard deviations.
IQR (Interquartile Range): Detect outliers based on quartiles.
Visualization: Plot data to visually identify outliers.
from scipy import stats
z_scores = stats.zscore(data['column'])
threshold = 3
outliers = data[np.abs(z_scores) > threshold]
5. Data Normalization and Standardization
Normalization and standardization ensure that data is on a consistent scale, which is crucial for algorithms sensitive to the magnitude of data points.
Normalization (Min-Max Scaling): Scales data to a range of [0, 1].
Standardization (Z-score Scaling): Scales data to have a mean of 0 and a standard deviation of 1.
from sklearn.preprocessing import MinMaxScaler, StandardScaler
# Example data
data = [[-1, 2], [-0.5, 6], [0, 10], [1, 18]]
# Normalize data
scaler = MinMaxScaler()
normalized_data = scaler.fit_transform(data)
# Standardize data
standardizer = StandardScaler()
standardized_data = standardizer.fit_transform(data)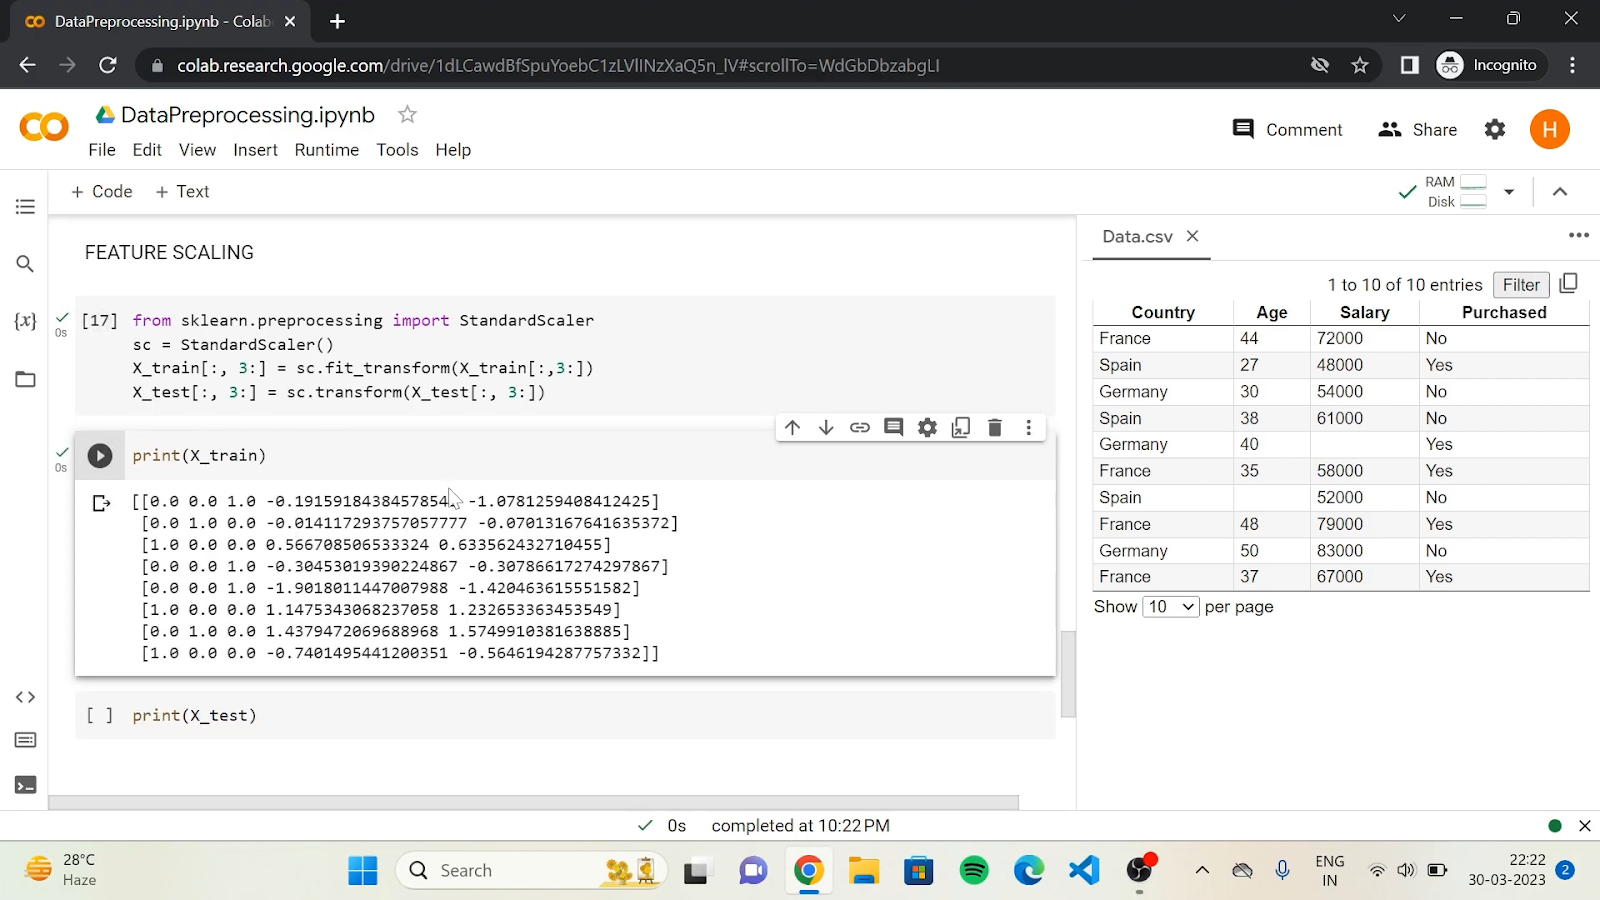
Frequently Asked Questions
What is the first step in ensuring data accuracy?
Define clear, measurable goals to guide your performance analysis. These objectives should be SMART: specific, measurable, achievable, relevant, and time-bound.
What are the methods used to ensure data quality?
Data quality controls are processes for maintaining data accuracy throughout its lifecycle. These include methods like data validation, cleansing, profiling, auditing, and governance. Data validation ensures data aligns with predefined standards and formats.
Conclusion
Poorly prepared data can lead to misleading results, faulty insights, and erroneous decision-making. By following these steps and using appropriate tools, you can significantly improve the quality of your data and the accuracy of your models, especially when working with big data. Happy data processing!