Data Visualization in R | A Beginner’s Guide
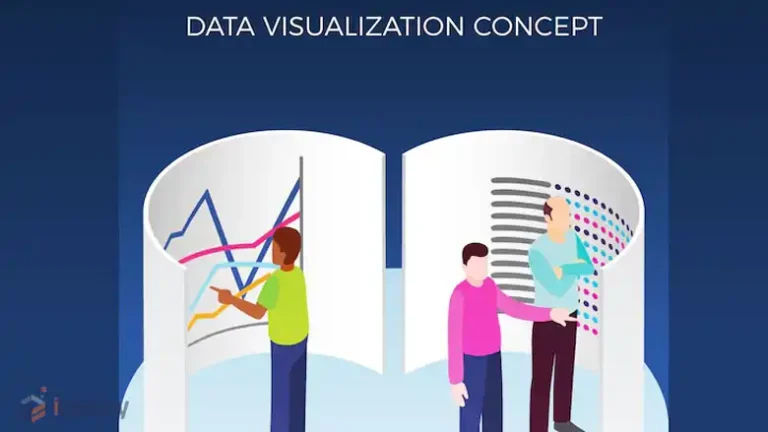
Data visualization is a crucial aspect of data analysis and interpretation, allowing us to see patterns, trends, and insights that might not be apparent from raw data alone. R, a powerful statistical programming language, provides a vast array of tools and libraries to create a wide range of visualizations. In this article, we will explore…


![Why Cache Memory Is Faster? [Explained and Compared]](https://www.iheavy.com/wp-content/uploads/2024/08/Why-Cache-Memory-Is-Faster-768x432.webp)


