How to Troubleshoot MySQL? 7 Best Ways
MySQL databases are great workhorses of the internet. They back tons of modern websites, from blogs and checkout carts to huge sites like Facebook. But these technologies don’t run themselves.
When you’re faced with a system that is slowing down, you’ll need the right tools to diagnose and troubleshoot the problem. MySQL has a huge community following and that means scores of great tools for your toolbox.
In this article, we have mentioned 7 ways that will troubleshoot MySQL effectively and efficiently. Let’s explore them below.
7 Ways to Troubleshoot MySQL
Here are 7 ways to troubleshoot MySQL:
1. Use Innotop
Innotop is a great tool for MySQL which despite the name monitors MySQL generally as well as InnoDB usage. It’s fairly easy to install, just download the perl script. Be sure to include a [client] section to your local users .my.cnf file (you have one don’t you?). Inside that section, place one line with “user=xyz” and one line with “password=abc”.
If you’re concerned that installing something new is too complicated, use the poor man’s version:
$ watch 'mysqladmin proc'2. Analyze & Tune Queries
You’ve heard it before, so I hope you’re already doing it. Not sure where to start? Enable your slow query log first. Set the long_query_time low enough to capture some queries.
Then use the great maatkit tool called mk-query-digest to analyze the slow.log file. The results will amaze you. You’ll quickly be able to sift for the heaviest four or five queries.
Next do an EXPLAIN for each of those queries from the command line prompt. Isolate those lines which return a large number of rows. Attempt to add columns in the WHERE clause to reduce these. Already have a where clause? Be sure that column is indexed. Try to reduce sorting, consider how you are joining tables, and so forth. Eliminate SELECT * and instead specify which columns you want, and which rows.
All these changes will make a huge impact on performance.
3. Verify & Troubleshoot Replication
Have you ever wondered if your replication is working properly? Do you wonder if all the data in your slave database perfectly matches your master database? As it turns out, the slave can silently drift out of sync with the master. We are lucky when this happens and MySQL returns an error.
In either case, you’ll need a tool to help you. There are two included in maatkit which will come to your rescue. The first mk-table-checksum is run periodically on the master. It creates checksums in a table, and that tables data propagates through replication to the slave. You then run another check with the same tool to verify the slave.
What happens if I find differences? Well, then you’ll turn to another wonderful Maatkit tool mk-table-sync designed specifically for that purpose. Check the manual for details on usage.
4. Use Aspersa
Another great tool by Baron Schwartz author of Maatkit is the Aspersa toolset. It helps you collect system information and then do performance profiling on that data. Great diagnostic tool.
5. General Database Tuning
You may want to get a birds eye view on what is happening in your database. How many tables are InnoDB versus MyISAM? Am I using indexes well? Am I doing too many joins? Are there some memory settings that are not quite tweaked as best they can be?
To be sure much of this type of knowledge is learned with years of experience, there is a tool that can give you a healthy start. Enter the MySQLTuner!
Grab a copy with wget. Since they grabbed a .pl top-level domain, the command is quite simple to remember:
$ wget mysqltuner.plThen set execute permissions, and go! Be sure to edit your .my.cnf file and include a [client] section so the tool can pickup your user/pass automatically!
6. Database Performance and Load Testing
As of 5.1 release of MySQL, all distributions include a really great tool for doing performance and load testing called mysqlslap. You can hand it a query, tell it to run that query 10 times, 100 times, or in 10 threads, and so forth.
It will fire consecutive queries at the database, and you can then capture the slow query log, or use innotop and the OS monitoring tools to see how the server responds.
7. Operating System Monitoring Tools
Most Unix folks are familiar with the interactive monitoring tool top. If you’re not, please fire it up and watch it for a little while. It will give your insight into what’s happening right now on your server.
Please also take a look at iostat to see what is happening as far as disk I/O goes. Databases are generally disk hungry so keep a close eye on this output. A tool called mpstat will give insight into what your processors are doing.
Incidentally, top can be configured to shop all of the individual processors as well, so check the options there for details. Lastly, sar can come to your assistance. The acronym stands for system activity reporter and tells you what Linux knows about the activity on the box.
Frequently Asked Questions (FAQs)
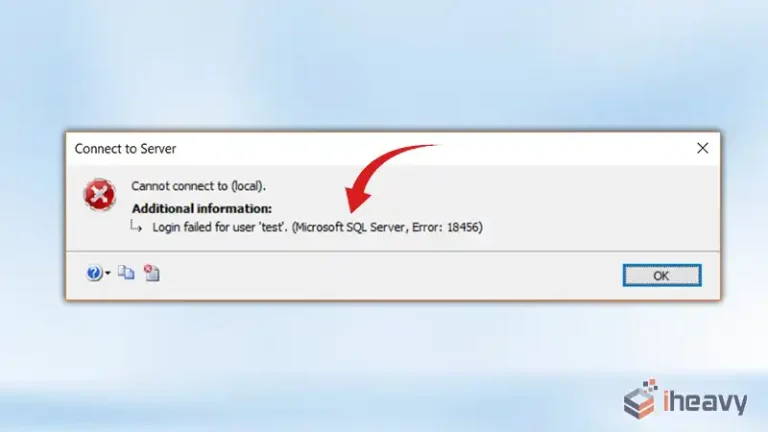
What Is Error 13 In MySQL?
Error 13 indicates that a permission has been denied. The OS user running the MySQL process may not have file access rights. Verify file permissions and check your OS manual or use the Perror tool to fix it.
How To Check MySQL for Errors?
The default location for these logs on Ubuntu systems is /var/log/mysql/error. You can analyze the error logs from there to identify the cause of slowdowns, crashes, or unexpected behavior.
What Is Error Code 1214 In MySQL?
The issue occurred due to an incorrect table type. Full-text indexes are only compatible with MyISAM tables in MySQL.
Conclusion
All the seven effective ways to troubleshoot MySQL problems are described above this article and we hope now you can efficiently troubleshoot MySQL errors by implementing these solutions. For any further queries regarding this topic, our comment box is always open for you. Thanks for reading!

